

Applications for Plan Sponsors
Optimizing DC Plan Investment Lineups: A Comparative Analysis of Full vs. Core Menus
Executive Summary
Defined Contribution (DC) plans serve as the primary retirement savings vehicle in the U.S. Despite the increasing prevalence of target date funds, nearly 60% of DC assets remain outside Qualified Default Investment Alternatives (QDIA), making investment menu construction still important. An investment menu is a lineup of options, each belonging to a specific asset class. An asset class represents a category of investments with similar characteristics. (risk, return), like stocks, bonds, or real estate.
This paper analyzes the implications to performance, risk, correlations and fees of consolidating asset classes into single investments and decreasing the number of plan investment options.
Methodology
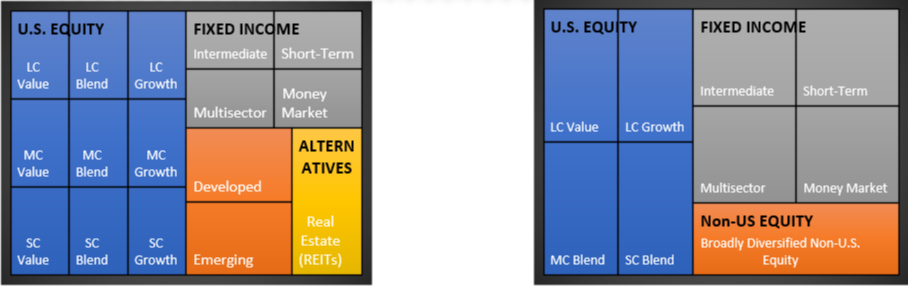
- The paper compares asset allocation models constructed from a Full Menu consisting of 16 investment options to a Core Menu consisting of 9 investment options. This does not include a QDIA.
- Compared to the Full Menu, the Core Menu omits the dedicated investments for the following 7 asset classes based on consistent high correlations (>0.90) with other asset classes and similar (marginally different) risk & reward results over long-term periods: Large-Cap Blend / Mid-Cap Value / Mid-Cap Growth / Small-Cap Value / Small-Cap Growth / Real Estate / Emerging Markets Equity. The core menu combines Foreign Developed Equity and Emerging Markets equity into one single option.
- The correlation between large cap growth and large cap value was low enough, and the risk and return characteristics divergent enough, to keep these two asset classes separate on both menus.
- We built objective-based asset allocation models, ranging from most conservative (income-focused) to most aggressive (growth-focused), with quarterly rebalancing applied.
- The implications to performance, risk, correlations and fees are examined by comparing the same objective models from their respective investment menus, ensuring a like-for-like evaluation. For example, in the Full Menu Aggressive Growth Model, the small cap equity exposure is 10% spread across three small cap funds. In the same model in the Core Menu, it is 10% in one small cap fund that offers exposure to all three.
- This paper utilizes data from Morningstar Direct, analyzing DC Full and Core Menus as of August 31, 2025. The study evaluates: asset allocation, performance spanning 3-30 years, risk-adjusted metrics and standard deviation, correlation matrices among asset classes.
- To test consistency of results, rolling quarterly periods were used instead of trailing metrics (return, risk, Sharpe Ratio, correlation, etc.)
- Investment options are represented by either only category averages, or only indices, or only actual funds from Mayflower’s list of recommended funds for each asset class. Findings that compare Full vs Core Menus remain the same regardless of the choice of investment options representation.
- The risk profile of an investor changes over time, making it essential for participants to adjust their portfolio’s risk exposure in response to evolving personal circumstances, such as investment time horizon, liquidity needs, outside assets, etc.
Conclusion(s)
- Both Full and Core Menus play an equivalent vital role in DC plans. The Full Menu provides greater diversification potential, while the Core Menu offers streamlined, stable investment options.
- The Core Investment Menu is a balanced approach that incorporates simplified core investment options and strategic diversification, while enhancing participant outcomes and supporting long-term retirement success.
- The Core Investment Menu reduces complexity while covering essential asset classes, fulfilling the fiduciary responsibilities, providing risk and return results similar to those of Full Investment Menu over long-term horizons. For plans with participants who may lack the knowledge or interest in researching investment option information, plan sponsors may consider limiting the number and variety of options. In addition, recent findings have shown that higher number of investment choices may reduce participation rates, causing participants to simply choose the safest option or over allocate to certain asset classes.
- Furthermore, over 5- and 10-year periods, investment menus composed of funds chosen by Mayflower have shown consistent absolute and risk-adjusted outperformance versus menus composed of indices only or category averages. This indicates strong selection and monitoring processes of funds chosen for Mayflower’s client menus.
Findings & Analysis
- Asset Allocation
- Despite the Core Menu having seven less investment options, allocations between the same risk models of Core and Full Menus remain similar (equities vs bonds, U.S. versus non-U.S. equities, large- versus mid- versus small-cap equities, cash and other assets).
- Performance
- Over long-term horizons (10–30 years), both menus exhibit comparable returns.
- Risk & Volatility Analysis
- Sharpe Ratios (risk-adjusted returns) are comparable between both menus over long-term horizons (10-30 years), and marginally higher for the core menu over shorter-term horizons
- Correlation & Diversification
- Some US Large Cap, Mid Cap, and Small Cap equity categories exhibit high correlations (>0.90)
- Real estate (REITs) inclusion in some Full Menu models provides further diversification but does not significantly reduce risk.
- Fees (Expense Ratios)
- On average, Full Menu funds have higher fees due to their broader selection of actively managed investments. Core Menu funds tend to have lower fees, as they focus on a more streamlined set of index-based investments.
Full & Core Menu Options – Risk & Reward Map
An effective investment menu is a lineup of options that give participants the ability to build diversified portfolios with distinctive risk and reward characteristics over long-term periods. An asset class represents a category of investments with such similar characteristics (risk, return), like stocks, bonds, or real estate. There is room to optimize the number of options on a plan menu if risk and reward characteristics of certain asset classes are similar over long-term horizons and correlations are consistently high (>0.90) between them.
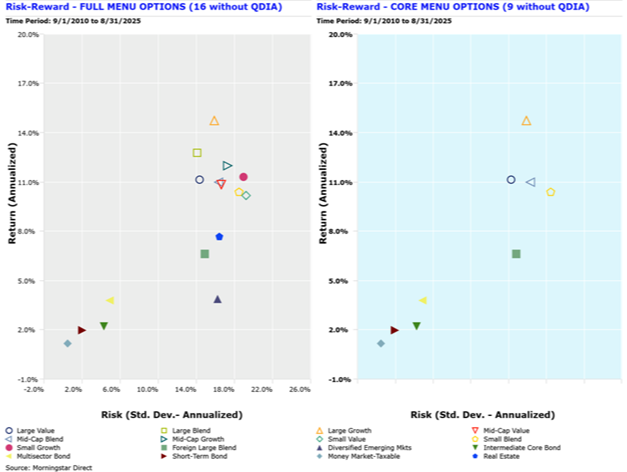
FULL Investment Menu (without QDIA) - 16 Options CORE Investment Menu (without QDIA) - 9 Options
Trailing Risk & Return: Full Menu vs Core Menu (as of 8/31/2025)
Trailing risk and return characteristics are similar between Full and Core Menus across different time horizons. The same is true for Rolling Returns – which are a better measure of consistency of risk and return results over any time frame.
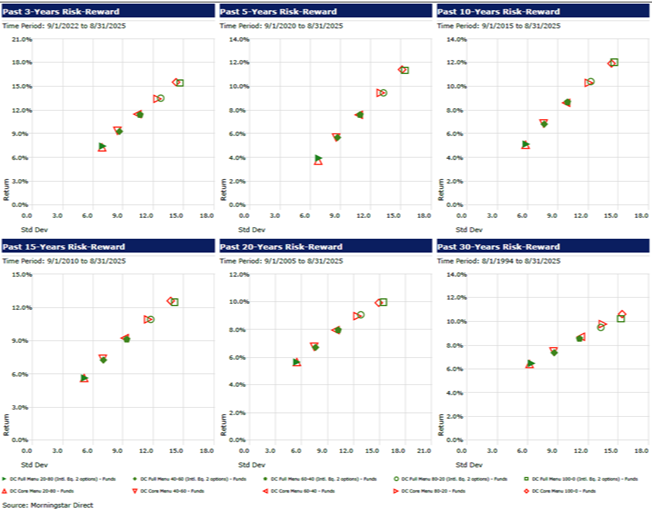
Full Menu MODELS (Non-US Equity 2 options) Core Menu MODELS (Non-US Equity 1 Broadly Diversified option)
References
- Mayflower - Morningstar Direct, Asset Class Analysis Report (2025)
- ERISA Compliance Guidelines for DC Plans
- Historical Performance Data of US and Non-US Equities
- T. Rowe Price Constructing More Effective Defined Contribution Investment Lineups (August 2023)
- Fidelity - DC Trends Client Slides 2025
Disclaimer
Past performance is no guarantee of future returns.
No investment strategy or risk management technique can guarantee returns or eliminate risk in any market environment. The information provided is for educational and informational purposes only and does not constitute investment advice and it should not be relied on as such. It should not be considered a solicitation to buy or an offer to sell a security. It does not take into account any investor's particular investment objectives, strategies, tax status or investment horizon. You should consult your attorney or tax advisor.
All information has been obtained from sources believed to be reliable, but its accuracy is not guaranteed. There is no representation or warranty as to the current accuracy, reliability, or completeness of, nor liability for, decisions based on such information and it should not be relied on as such.
Securities offered by Registered Representatives through Private Client Services, Member FINRA/SIPC. Advisory products and services offered by investment advisor representatives through Mayflower Financial Advisors, LLC (dba Mayflower Advisors, “Mayflower”), a registered investment advisor. Private Client Services and Mayflower are unaffiliated entities.